
My name is Keisuke Taketani. I do facilitation and visualisation. Watch a video at Asian Evaluation Week, explaining graphic facilitation .https://www.youtube.com/watch?v=uNaImYVBadk

Posted on 03/09/2021
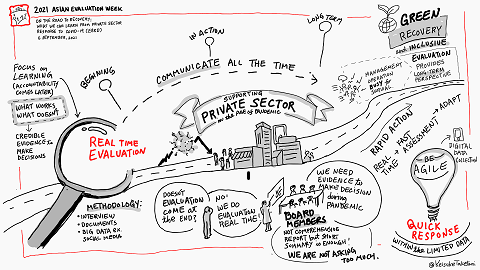
Dear Gordon and colleagues,
Communicating evaluation findings in concise, comprehensible and meaningful way is a challenge. How many people actually read 150 page report?
UN WFP in Asia Pacific region is attempting to solve this issue by combining Evaluation with visual facilitation. The methodology is called EvaluVision.
3 min explainer video and e-book hopefully give you idea of how to use visualization and facilitation technique to design, validate, and disseminate evaluation. There are more videos and case studies in the e-book.
Next week, on 8 September from 9:00 – 12:00 a.m. (Manila time), we will present EvaluVision as a part of ADB-WFP organized learning session "Engage to Communicate: Stakeholder Analysis for Communicating Evaluations" during the Asian Evaluation Week. The learning session will be 9:00-12:00, but EvaluVision is set for 11:00-12:00. For more information, please visit AEW site . I attached the e-flyer as well.
We need both literal and visual thinking to make use of evaluation.
Philippines
Keisuke Taketani
Graphic facilitator
Freelance
Posted on 19/07/2023
Hi everyone,
I really enjoy the active discussion. It seems that we realize there are many aspects of visualization in terms of tools, audience, and purpose, and this is just the beginning of the beginning.
Coincidentally, I received a notice this morning that specialized online training in data visualization and evaluation is launched.
https://lovingvisuals.com/.
The person behind the course is someone I can trust in both evaluation and visualization. This could be a good venue for anyone who wants to use more visualization in evaluation reports and more.
Cheers,
Keisuke
Keisuke Taketani
Graphic Facilitation and Design
www.keisuketaketani.com
Philippines
Keisuke Taketani
Graphic facilitator
Freelance
Posted on 03/07/2023
Dear Harriet,
Many thanks for starting a discussion close to my heart!
Let me share the latest development of WFP EvaluVision, as you kindly shared as an example. After trying to set a foundation of methodology, EvaluVision is now focusing on finding and strengthening local talent. WFP Nepal conducted a stakeholder workshop to discuss a baseline study of the school feeding program. I worked with a local artist to share the overall EvaluVision methodology. A documentary video is being edited at this moment, so I might be able to share it before this discussion closes.
Besides EvaluVision, I recently asked to help several WFP country offices to visualize the Theory of Change. After going through several technical workshops to formulate ToC, it was suggested to make a one-page visual without any technical terms. I proposed that, after drafting an illustration, organize a coloring contest where any staff or their family can participate. The winner was the daughter of the WFP staff. I realize this is more like a vision board than a Theory of Change, it helps to explain the overall purpose (how success looks like) and how we get there. More details and the winning entry on a LinkedIn post here
Another use, as wisely pointed out by Harvey Garcia in earlier posts is a crossroad of evaluation and data analysis. I see a big potential for using big data for evaluation. I am not a data scientist who can share many insights, but please allow me to share a graphic summary of a very interesting discussion of evaluation and artificial intelligence organized by EBRD last year. I suppose it's not so far future when AI will create a summary drawing if you upload a 100-page evaluation report. (or maybe is there such a tool available already?)
Cheers,
Keisuke
Keisuke Taketani
Graphic Facilitation and Design
www.keisuketaketani.com